
Disclaimer
This piece reflects the authors' personal views, not those of any employer or client. It describes working methods in general terms; it contains no client data and no confidential information. It is not professional advice.
In a traditional FDD, working files feed the databook, the databook feeds the slides, and the slides become the report. Change one number upstream, and someone refreshes, reconciles and re-reviews everything downstream.
And diligence is not a one-way pipeline. Analysis raises questions, management answers them, and the answers bring new requests, new analysis and sometimes new adjustments. Findings shift as the team challenges the answers and decides what matters for the deal.
So how much of this can AI actually take on?
Over the past months, we have been exploring what an AI-native FDD workflow could look like if the process were designed around one live deal model rather than a chain of separately maintained deliverables.
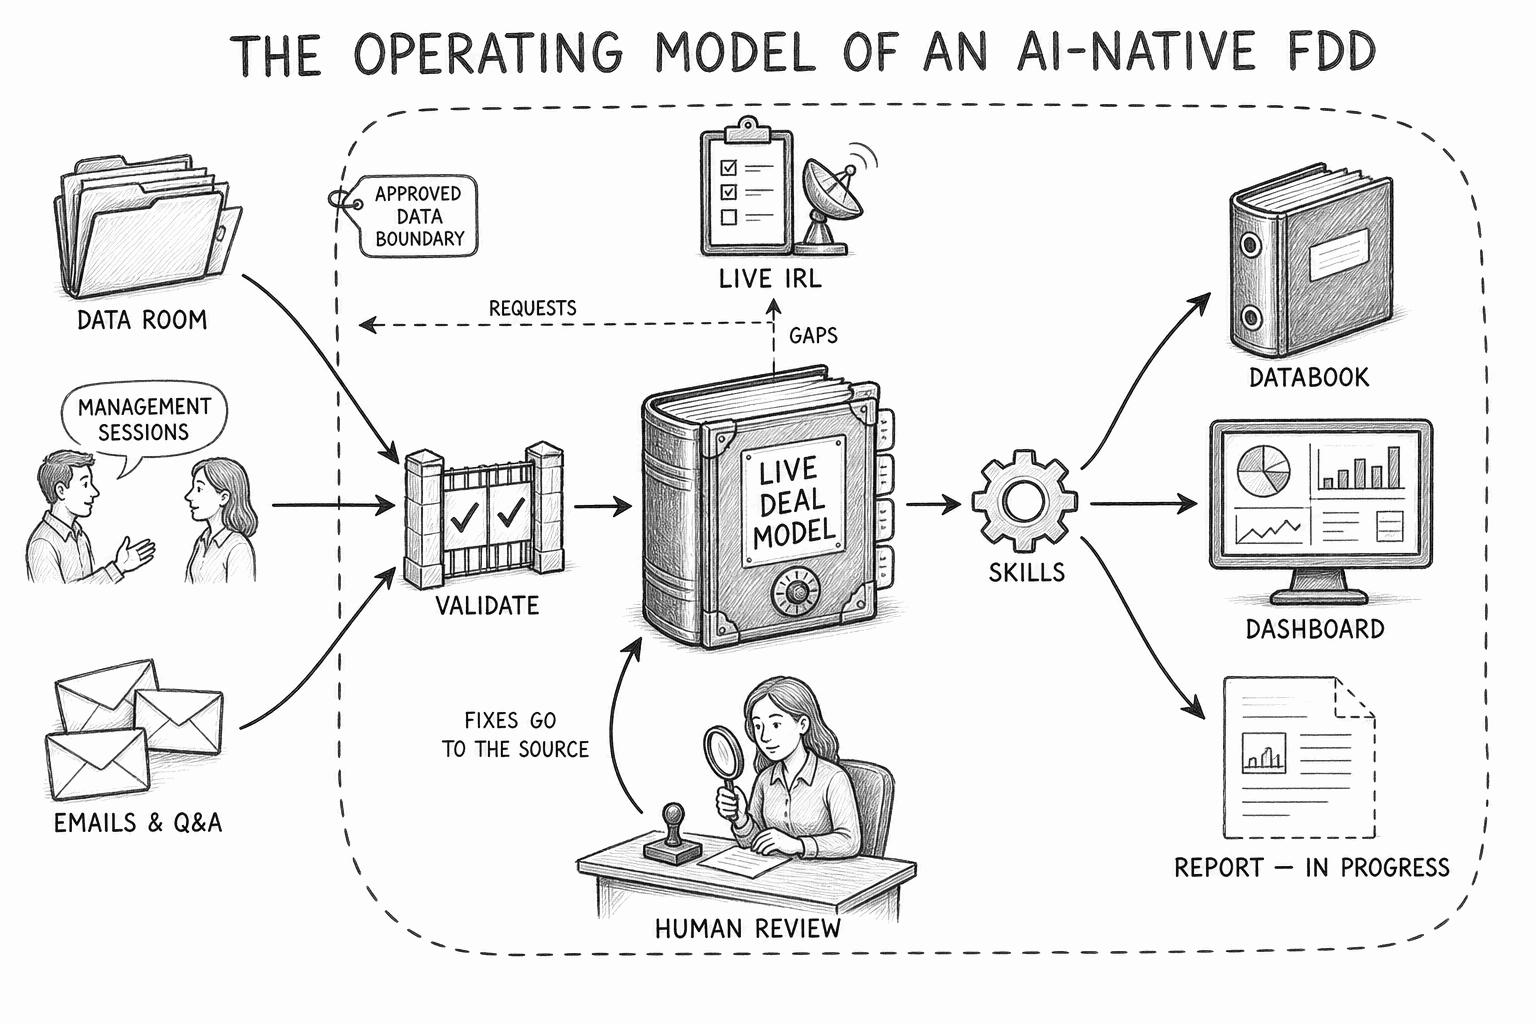
The idea is simple: maintain the underlying deal model once and generate the analytical views and deliverables from it through reusable skills — written methods for recurring tasks, each given the context it needs.
The judgment stays with the team: what to investigate, which explanations to challenge, what is material and which adjustments to accept. AI can increasingly help build and execute the analysis. It should not decide the deal view.
We built a data model
A live deal model is a single working copy of the deal. In engineering terms, ours was built around versioned, keyed tables. Ingested numbers retained their source references; derived numbers retained the transformations that produced them. It held the standardized financials, the operating data and the KPIs. It also held what usually lives in people's heads and inboxes: management explanations, proposed adjustments, open items, and the team's evolving assessment.
Alteryx workflows and Python scripts handled the transformations. AI read the raw files and drafted the mappings across trial-balance accounts, management reporting structures and legal entities, and we confirmed them. On top sat the analytical views — reported, management-adjusted, buyer-adjusted — each retaining its link to the numbers underneath. We designed the structure and the analytical logic. AI did a growing share of the building, and we checked what it built. New information entered the model once.
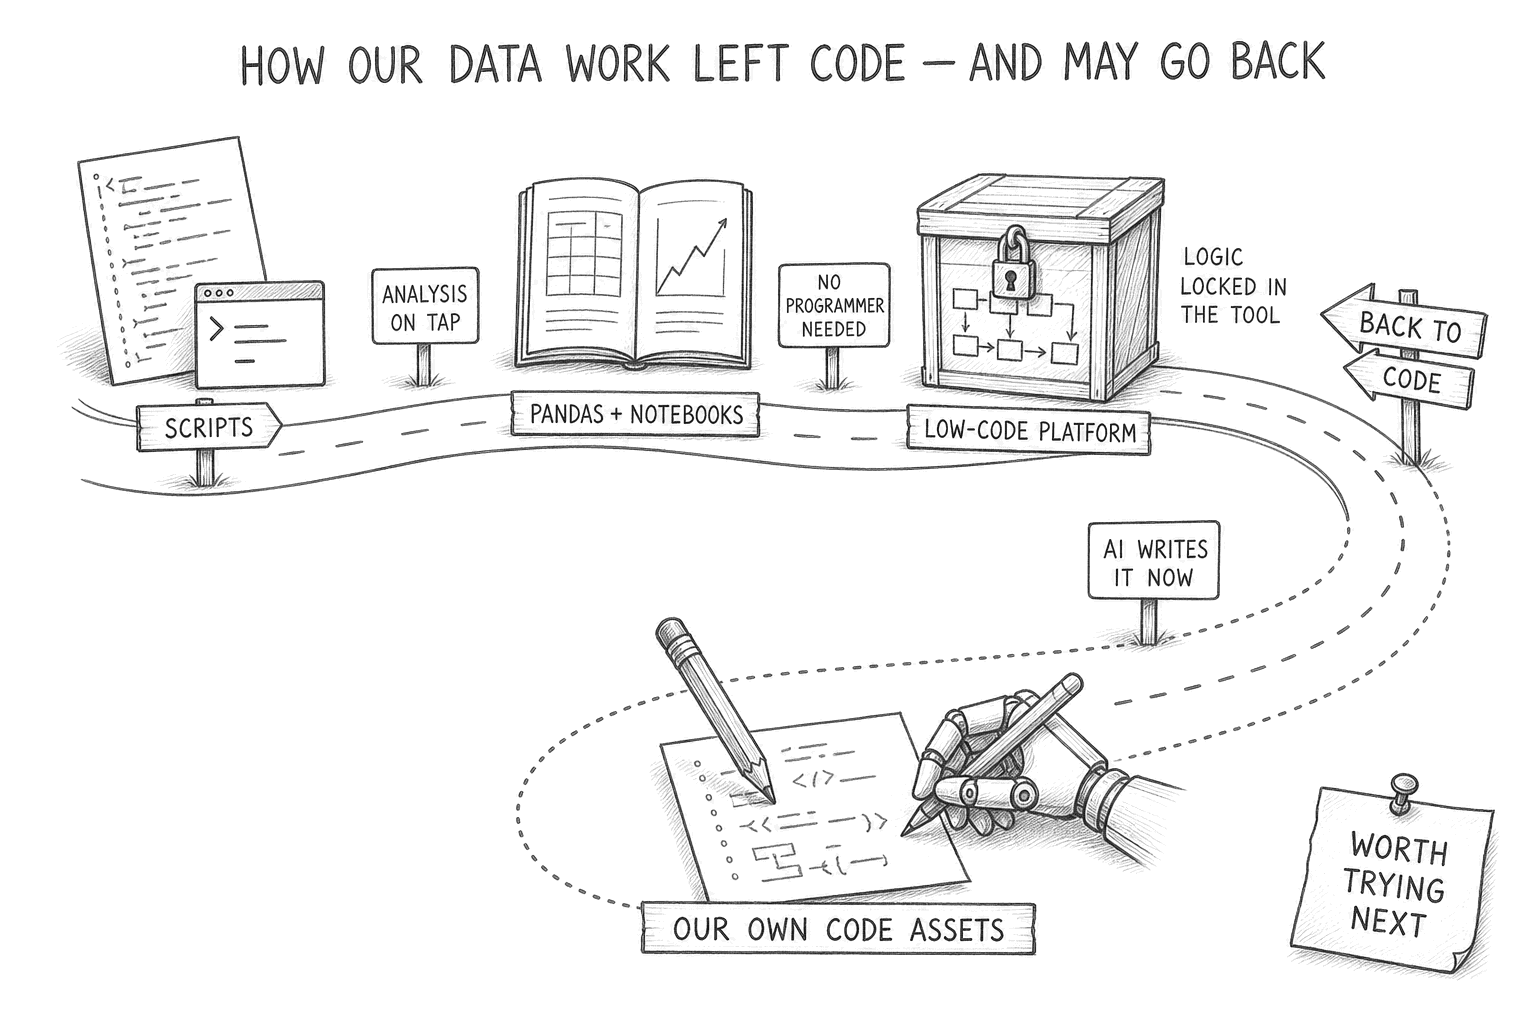
Our data work also raised an interesting technology question. Financial data work has moved from scripts to pandas and Jupyter, and then out of code altogether towards low-code platforms, because they are faster to build in. AI may change that trade-off again. A closed product exposes relatively little of its internals, and it cuts off your own access to them. That makes AI-driven data work hard. Code is different: AI can read it, write it, test it and modify it. In code, AI writes the scripts and the modules, and we end up with our own software for FDD data work. Building that used to be out of the question: no skills, no headcount, no budget. Writing code has become cheap enough that the question is no longer what we can afford to build, but which parts of the work are worth automating.
We had to redesign the workspace first
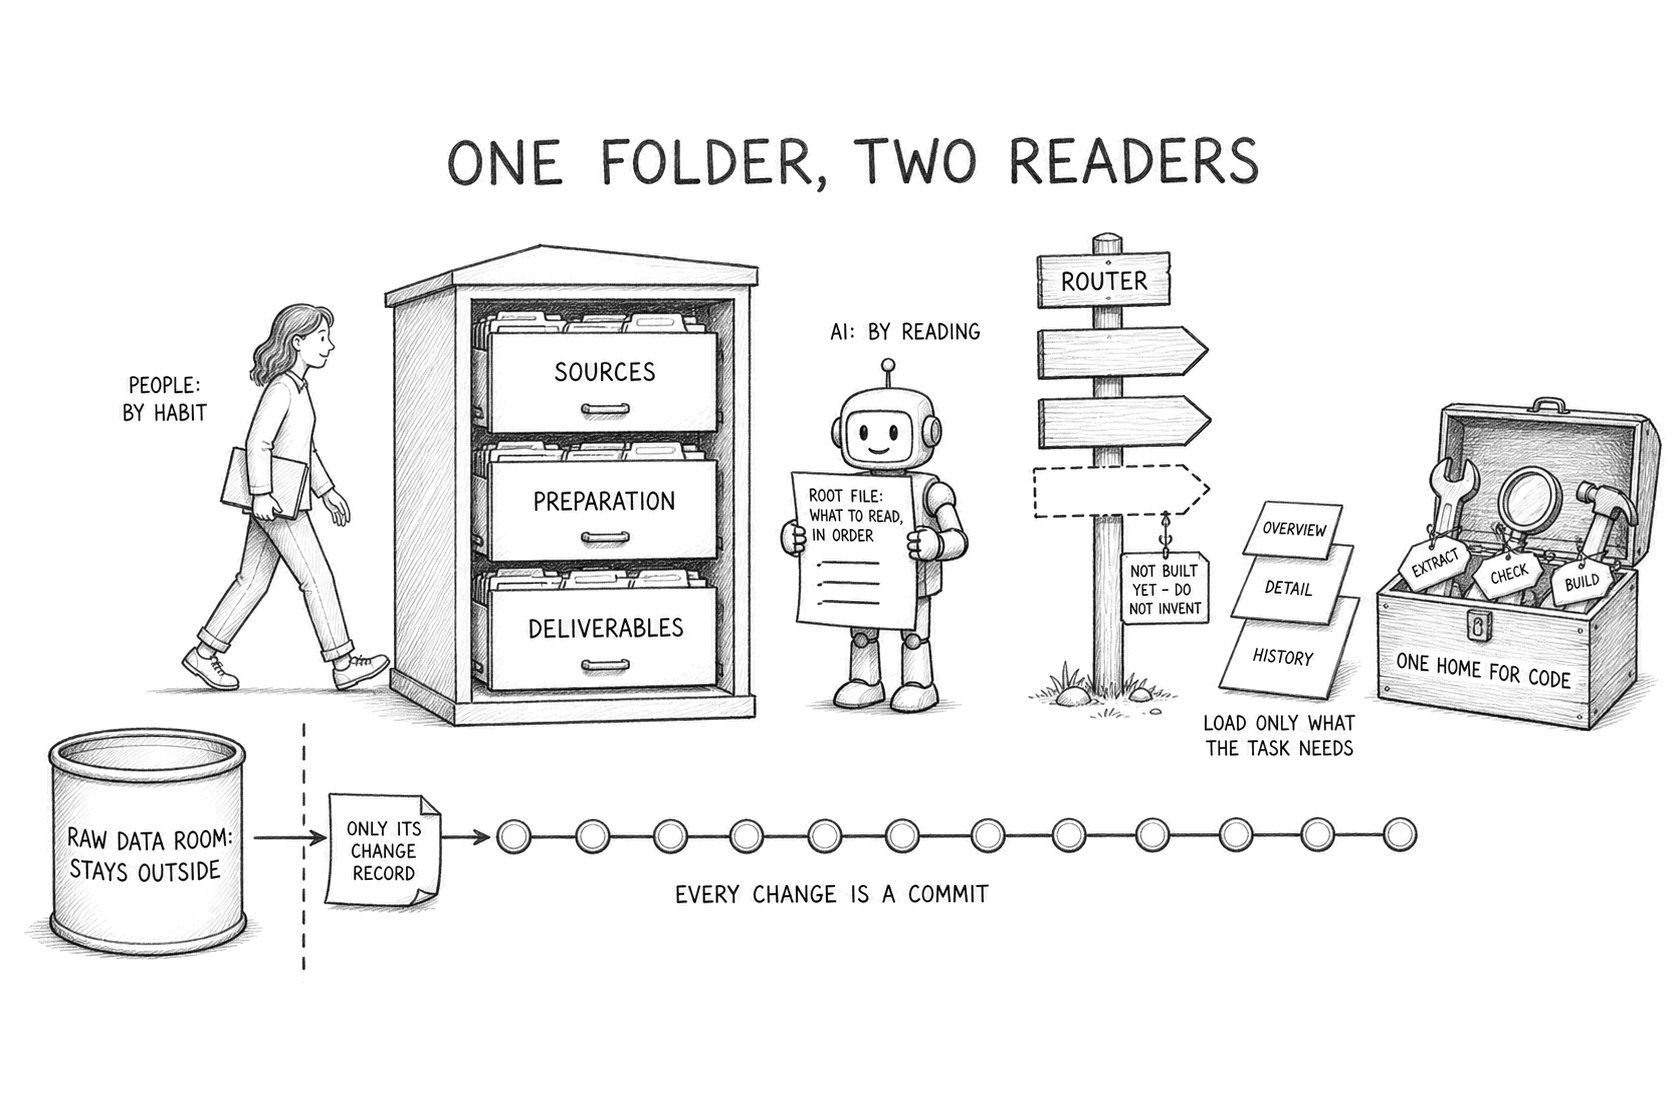
A typical FDD project folder is a shared drive organized for the people working in it. AI cannot work from it. An agent needs a harness: documentation it can navigate, skills it can call, code it can reuse, and permissions that tell it what it may touch. A shared drive full of workbooks, decks and PDFs has none of that. A software repository fails the other way: FDD teams are not software-development teams, and most of the material they work with is not code.
So we built one workspace that serves both. People work in it as before: the folders follow the engagement's phases, originals stay read-only, and generated outputs never mix with source material. Every document in the data room also has a machine-readable extract. A root instruction layer provides the project context and tells the agent where to start. A router maps each task to its instruction file, and marks what does not exist yet, so the agent does not invent it. The principle is progressive disclosure: start with the overview and load deeper methodology only when the task requires it. The code for extraction, checks and builds has one home and is reused, not rewritten.
The whole workspace is a git repository. Work lands as commits; the raw data room stays outside, and each refresh leaves its change record in the history. Any implementation of this model has to operate within the applicable confidentiality, data-access, security and retention requirements.
A shared drive stores files. An AI-native workspace stores files, instructions, state and history.
Building a live information loop
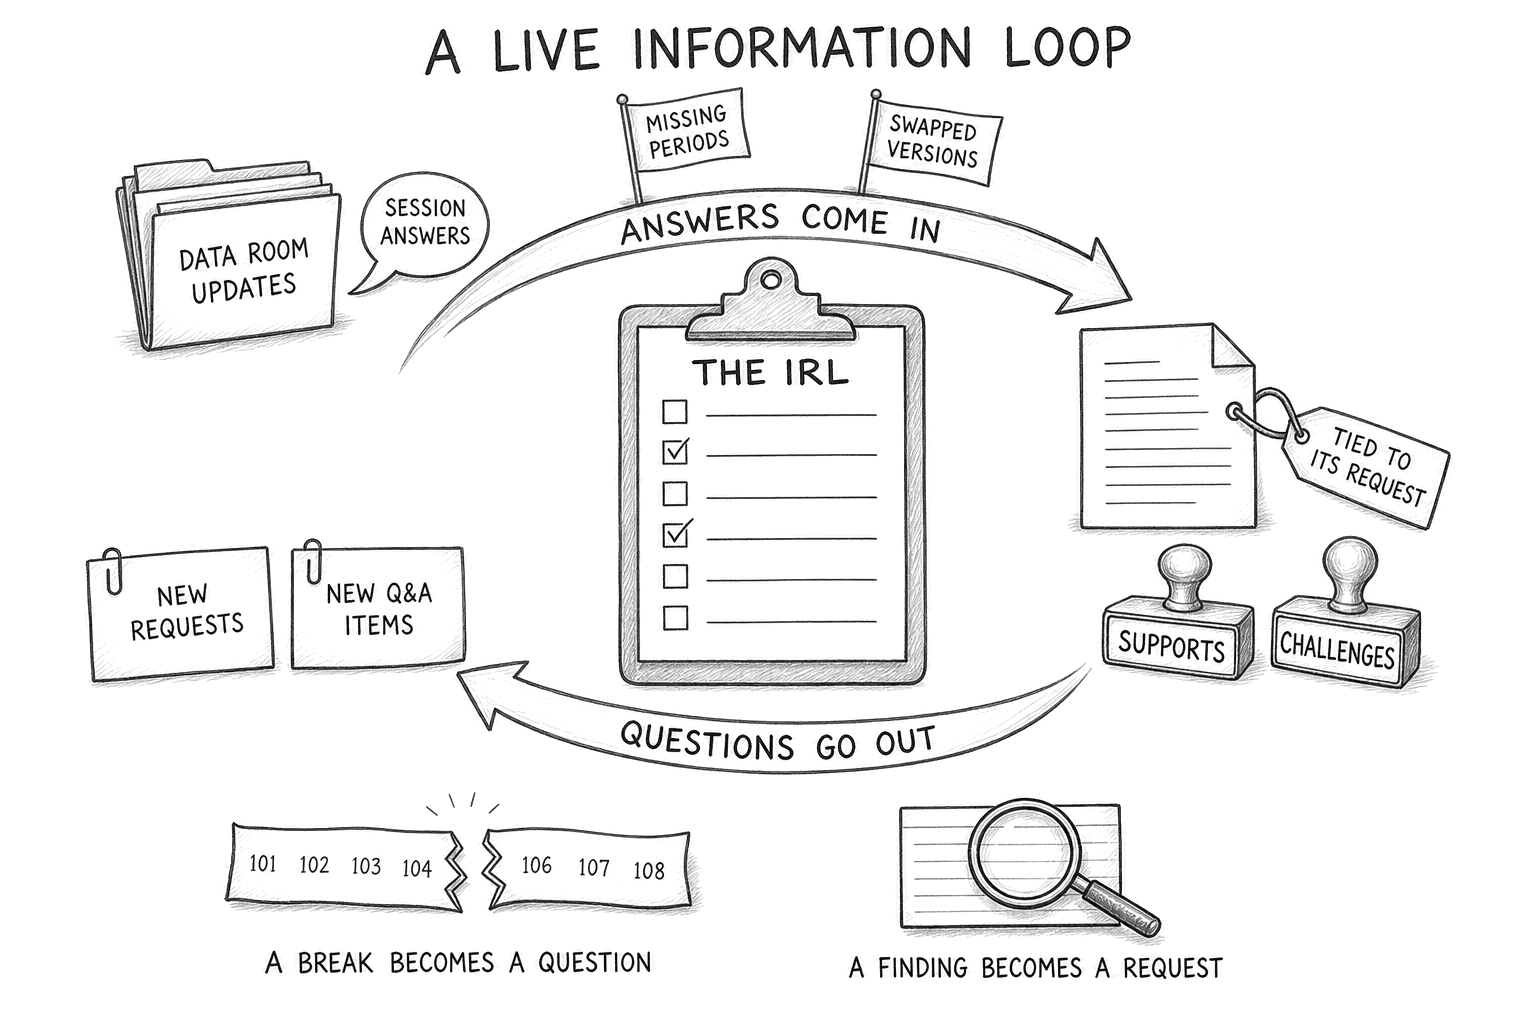
The same principle applies to the information request process. An information request list does not have to be a static tracker. It can become part of the model, connecting what the team has asked, what has arrived, what remains unanswered and which analyses depend on it. AI compares data room updates against outstanding requests and flags missing periods, versions swapped without notice, and open questions.
Management and expert discussions can feed the same loop. An answer may confirm what the analysis has shown, challenge it or add context. It may also create another question or require documentary support. Analysis works in the other direction. A reconciliation break can become a question. A finding can create an information request that the original scope could not have anticipated.
The result is a loop rather than a pipeline: data → analysis → questions → answers → evidence → revised analysis.
Whatever enters the model arrives tied to its request. Where it bears on a management explanation, it is marked: supports, or challenges. The useful part is not simply automating the IRL. It is preserving the relationship between the request, the evidence, the explanation and the analysis that depends on it. Each new arrival tells the project what it knows, what it still needs, and which analyses have to be re-run or rethought.
The deliverables became views of the model
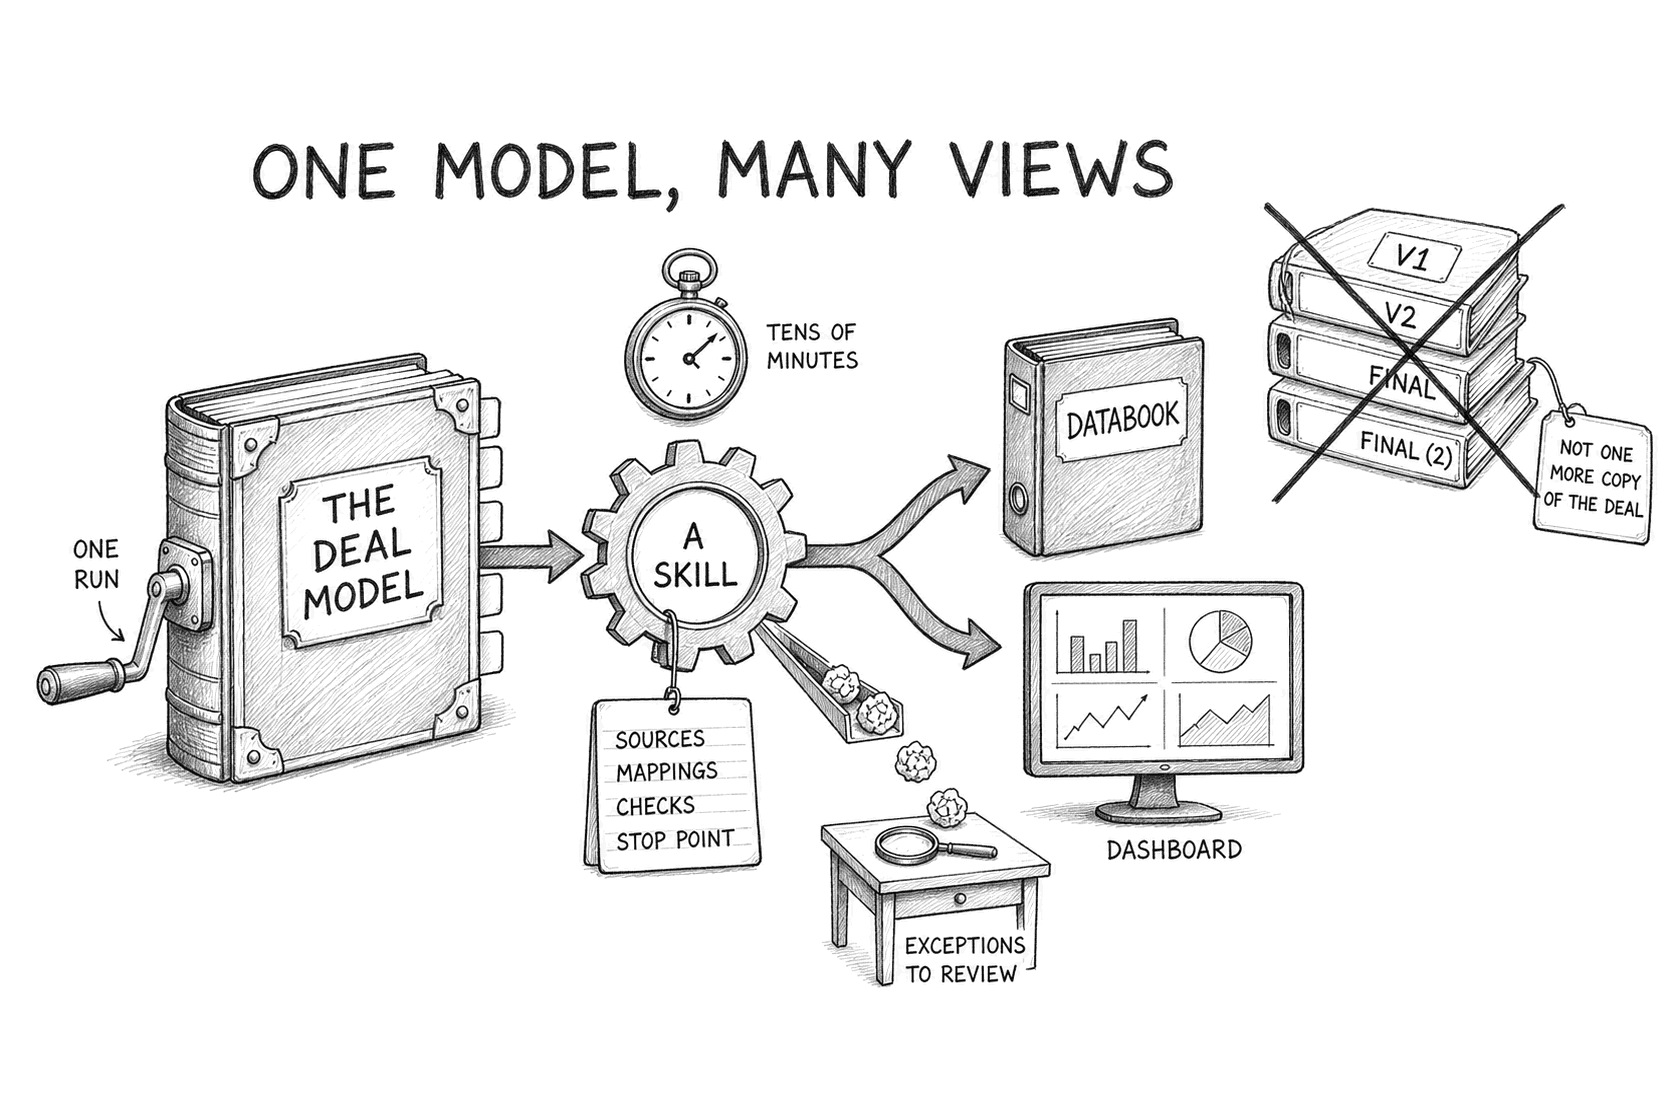
New information was reconciled into the model before it reached a databook tab or dashboard. A skill generated each view. For revenue, the skill named the sources, the customer and revenue-stream mappings, the checks to run before the numbers could be trusted, and the point where it handed off to a person. The checks themselves were not new. They were the same checks an FDD team would perform manually. The model could cut revenue by customer, stream or geography. What drove the trends, and what it meant for the deal, stayed the team's call.
Once the model and the skill had matured, rebuilding the databook was one automated run. It took tens of minutes and usually came out reconciled. Exceptions went to review rather than requiring the entire output to be rebuilt by hand. A dashboard could use the same underlying data, reducing the risk of parallel versions drifting apart.
The change that mattered was not speed. Each new analysis stopped becoming one more separately maintained version of the deal.
Keeping the judgment with the team
The report is where the boundary between execution and judgment is clearest. Skills can already draft report slides from structured data and analysis. But a report is not one more view of the model. It is the team's view of what the numbers mean: which explanations hold, which issues are material, what the findings mean for the buyer. AI can reproduce analysis and draft an output. It should not decide the deal view.
What we cannot yet do is keep that judgment connected to the model: the evidence considered, the narrative, the reviewer decisions, the approved manual edits. A correction made in review should improve the source of the report, not only the current PowerPoint file.
People challenge management's explanations and approve every adjustment and every output. The project no longer loses its state at human handoffs. The aim is not to automate judgment. It is to automate more of the work required to get there without losing the data, the evidence and the decisions along the way.
Next: a deal graph
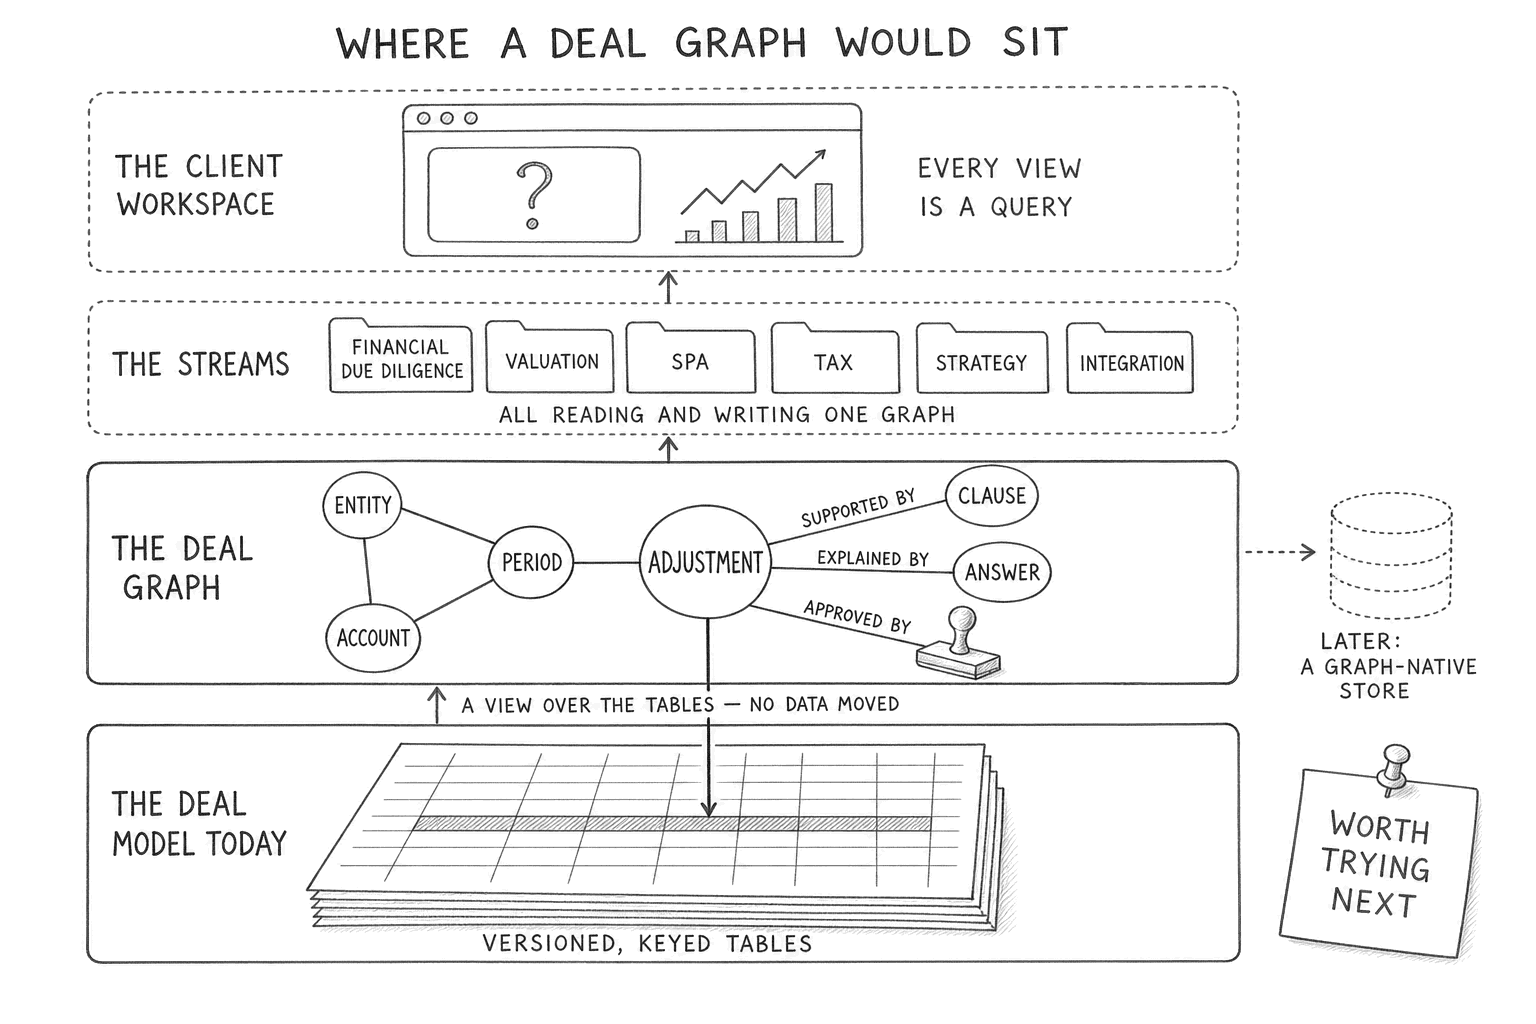
The model handles structured data. The harder part is the relationships around it. Take one adjustment in the databook. It exists because management explained a number in a call, a contract clause backs the explanation, analysis quantified the impact, and a reviewer accepted it. Today that chain lives in an email, a comment cell and someone's memory. In a graph, each piece is a node, and each link is a record: which page, which extraction run, who accepted it, when.
Once the chain is data, chain questions become queries. Which findings rest on this answer? This number changed, what has to re-run? Today each of those costs an afternoon of tracing. On a graph it is one query, and the answer is exact.
The agents need this even more than we do. An agent forgets everything between runs; its window only holds so much. The graph would be its memory: it writes in what it extracts, with the source attached, and queries the relevant context when it needs it.
And we would not need a new database. A graph can be defined on top of the keyed tables we already have, the way a view is. The tables keep producing the schedules. The graph answers the chain questions. Nothing is copied; if it does not earn its keep, delete the view and nothing is lost.
Financial, commercial and tax diligence each rebuild the same picture of the target today. On one graph they could share it, each keeping its own questions. And it would outlive the deal: the same graph is the baseline the first hundred days run on. All of that is still ahead of us. But the data room of the future is a database, not a folder of PDFs.
Once the model and the skills are mature, one more analysis is one more run, and AI can run many in parallel; the work shifts to deciding which analyses matter, designing their logic, and challenging what comes back. What we have not solved is what carries forward. The methodology should compound — mapping logic, validation checks, analytical methods and reusable tooling. Engagement-specific information should not — client data, management answers, evidence and deal-specific judgments belong to the engagement in which they were created. Getting that boundary right matters as much as the automation itself. The deliverable can be stored as a file; the links behind it cannot. Keeping those links changed more for us than any single automation did. We stopped treating the deliverable as the project.